Charts
The Charts dialog represents how different values calculated by Ergoniza Intelligent develop over a Multiple postures activity.
Open it with Charts in the left-side menu. It is available only in Multiple postures mode because charts require a temporal sequence.
It can display, compare, export, and review biomechanical exertion, cumulative loads, lumbar compression, load distribution, postural results, and other indicators.
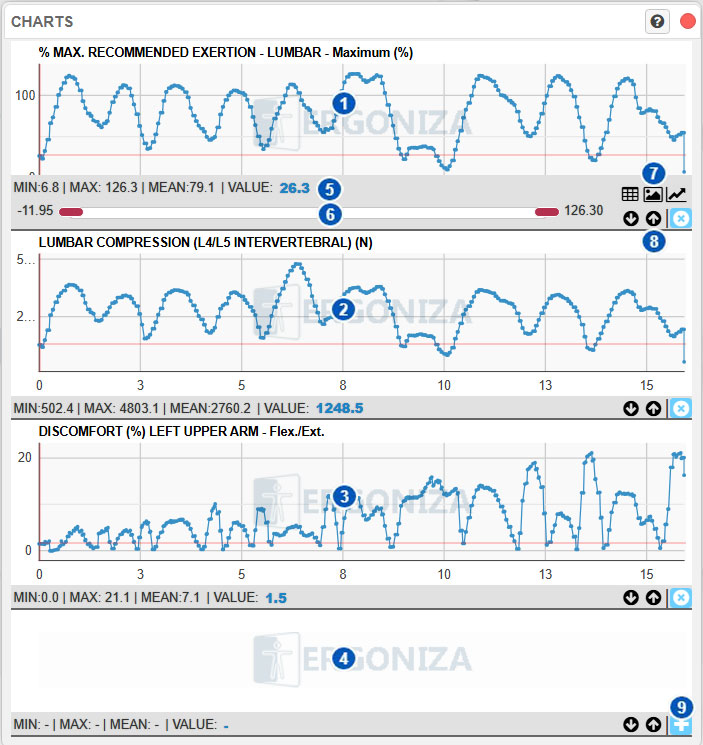
The screenshot corresponds to one analysis configuration. Exertion-chart titles adapt automatically to the selected indicator.
| No. | Area or control | Function |
|---|---|---|
| 1 | Chart slot 1 | First available area for a temporal chart. |
| 2 | Chart slot 2 | Second available area for a temporal chart. |
| 3 | Chart slot 3 | Third available area for a temporal chart. |
| 4 | Chart slot 4 | Fourth available area for a temporal chart. |
| 5 | Numerical summary | Displays minimum, maximum, mean, and current-time values. |
| 6 | Visible vertical-axis range | Adjusts the minimum and maximum values displayed. |
| 7 | Chart tools | Exports data, downloads a chart image, or changes the representation mode. |
| 8 | Chart organization | Moves the chart to another slot or removes it. |
| 9 | Add chart | Opens New chart to select the variable to represent. |
Purpose of the dialog
Charts show how results change over time in an activity composed of multiple postures. They help identify:
- exertion peaks;
- periods of high cumulative load;
- critical activity phases;
- sudden changes between postures;
- times when a value exceeds a limit;
- differences between work and rest phases;
- effects of repeated cycles.
Charts complement result dialogs by locating important values in time.
Chart slots
Areas 1 through 4 are the four available chart slots. Each can contain a different chart, allowing simultaneous comparison—for example:
- a joint’s exertion or capacity indicator;
- lumbar compression;
- load distribution at a leg;
- cumulative exertion load for a muscle group.
An empty slot is available for a new chart.
Add a chart
Select +, identified by number 9, to open New chart, choose a variable, and insert it in the corresponding slot.
Some types are available only when their calculation is active. Cumulative exertion is offered only when Include repetitions and rest periods is enabled under Activity repetitions. Otherwise cumulative biomechanical load is not calculated.
Update charts
Charts depend on the temporal activity, postures, loads, and analysis settings and can become out of date after:
- changing a posture or sequence duration;
- changing loads or forces;
- changing model parameters;
- changing activity repetitions;
- changing Calculate % max. recommended exertion, Include cumulative exertion load in recommended exertion %, or other analysis settings;
- recalculating biomechanical or postural results.
When an update is required, the panel can be highlighted in red and a red button appears at the top.
Control changes can alter both values and the chart name or reference capacity. Regenerate charts before comparing configurations or drawing conclusions.
Numerical summary
Area 5 normally displays:
- MIN: minimum value;
- MAX: maximum value;
- MEAN: mean value;
- VALUE: value at the animation’s current time.
The current value updates as you move through the animation or select a chart point.
Temporal selection from a chart
Selecting a chart moves the animation to the corresponding time.
Use this to locate the posture associated with a peak, drop, or other relevant value:
- Locate the critical area.
- Select it.
- Review the model posture at that time.
- Open related result dialogs.
- Change the posture, load, or task if necessary.
Adjust the visible range
Controls 6 adjust the displayed vertical-axis range.
This changes only the on-screen scale, not calculated data. It is useful when extreme values compress the curve, a particular range requires closer review, activity phases must be compared, or automatic scaling is unclear.
Chart tools
Area 7 provides tools to:
- export chart values to CSV;
- download a chart image;
- switch to a stepped representation.
CSV export
CSV preserves numerical series for external analysis, documentation, or spreadsheet review.
Image export
Image export preserves a visual capture for documentation or comparison.
Stepped representation
A stepped signal uses constant intervals and can clarify correspondence between discrete postures and values.
Organize charts
Controls 8 move a chart down, move it up, or remove it.
Use them to arrange several variables and place the most relevant ones at the top.
Relationship with Multiple postures mode
Each chart point corresponds to an animation time. Chart quality therefore depends on a correctly defined temporal activity.
Before interpretation, verify:
- posture accuracy;
- animation timing;
- load assignment;
- realistic repetitions and rest periods;
- current related analyses.
See Activity repetitions.
Relationship with result dialogs
Depending on the chart, review its source result under:
- Exertion
- Exertion and joint-capacity indicators
- Cumulative exertion load
- Lumbar compression
- Postural load
- Postural load: Discomfort
- Postural load: REBA
- Postural load: LUBA
- Stabilogram
The chart locates when a result occurs; its calculation is explained in the corresponding section.
Practical interpretation
- Add the variables to analyze.
- Regenerate charts if they are out of date.
- Review minimum, maximum, and mean values.
- Identify peaks, drops, and critical phases.
- Select relevant points to move the animation there.
- Review posture and numerical results.
- Adjust the visible range if needed.
- Export data or images for documentation.
Precautions
- An outdated chart may not represent the current activity.
- Peaks can reflect sudden transitions between postures.
- Poor scaling can exaggerate or conceal variation.
- Mean values do not replace maximum-value review.
- Interpret a high value together with the posture and load at that time.
- Temporal results and cumulative-exertion charts depend on repetitions and rest. When Include repetitions and rest periods is disabled, cumulative-exertion charts are unavailable.
Regenerate charts after changing the activity.
Related manual sections
- New chart
- Activity repetitions
- Exertion
- Cumulative exertion load
- Lumbar compression
- Postural load
- Stabilogram
Relationship with the Technical foundations
For methodological details, see:
- Conceptual differences between single-posture and multiple-posture analysis
- Cumulative exertion load in multiple-posture analysis
- Concept of cumulative exertion load
- Temporal integration of dose and cumulative-load update
- Repetitive tasks and rest between repetitions
- Postural discomfort
- Analysis of overexertion risk
- Lumbar compression and shear risk analysis
These sections explain charted variables and precautions for interpreting temporal results.