New chart
The New chart dialog selects an analysis variable and adds it to an available slot in the Charts dialog.
Open it by selecting any + button in Charts. Each button adds the new chart to its corresponding slot.
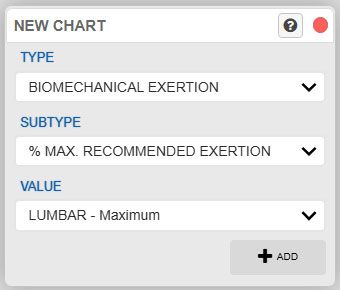
The screenshot shows the terminology for the configuration active when it was created. The names of some subtypes change automatically when biomechanical-analysis options change.
| Control | Function |
|---|---|
| Type | Selects the main family of variables to be represented. |
| Subtype | Selects a specific variable within the chosen type. |
| Value | Selects the body segment, joint, degree of freedom, or specific variable to represent. |
| Add | Adds the selected chart to the slot from which the dialog was opened. |
Purpose of the dialog
Use New chart to define the variable to represent under Charts.
Ergoniza Intelligent can plot different results calculated during a multiple-posture activity. These charts help analyze temporal development, locate peaks, compare activity phases, and quickly access the animation time at which a value occurs.
This dialog does not itself calculate results. It selects the result to add to the chart panel.
Type selector
Type selects the main chart family.
Available types can include:
- Biomechanical exertion;
- Cumulative exertion;
- Discomfort;
- REBA score;
- LUBA score;
- Angles between body segments;
- Lumbar compression;
- Weight distribution between supports.
Each type groups a different set of variables. Biomechanical exertion, for example, groups results related to exertion calculated at joints and degrees of freedom. Lumbar compression groups lumbar compression and shear results. Weight distribution between supports provides variables related to load distribution among the model’s supports.
The selected type determines the options under Subtype and Value.
Some chart types depend on the active analysis configuration. In particular, Cumulative exertion is available only when Include repetitions and rest periods is enabled under Activity repetitions. When disabled, cumulative biomechanical exertion is not calculated and this chart type does not appear. When Calculate % max. recommended exertion is enabled, the cumulative-load chart shows the result with the weighting used to establish preventive priorities. When disabled, it shows the unweighted base cumulative load.
Subtype selector
Subtype selects a specific variable within the chosen type.
For Biomechanical exertion, for example, available subtypes can include:
- the active exertion or capacity indicator, named % max. recommended exertion, % recommended joint capacity, or % maximum isometric capacity used;
- % unprotected population;
- joint moments.
Other chart types provide different subtype options. Under Discomfort, they relate to postural-discomfort values. Under REBA score or LUBA score, they relate to method-specific results.
This selector specifies the class of result to be plotted.
Value selector
Value selects the specific variable to plot.
Depending on the selected type and subtype, it can contain:
- a joint;
- a body segment;
- a degree of freedom;
- the maximum across a segment’s or joint’s degrees of freedom;
- a side of the body;
- a biomechanical variable;
- a postural index;
- a force or moment component;
- a lumbar variable;
- a load-distribution value for the supports.
For Biomechanical exertion, the active-indicator subtype can, for example, let you select a joint and movement such as lumbar flexion or exertion at a shoulder, elbow, wrist, hip, knee, or ankle. The subtype name updates automatically to indicate the capacity or limit being used.
The number of options changes when Type or Subtype changes.
Add button
Add inserts the selected chart in the slot from which the dialog was opened.
The chart then appears under Charts. You may need to update or regenerate the chart set with the red button at the top of the Charts dialog.
Selecting a chart defines the variable to represent, but its data must be generated or updated from the current temporal activity.
Subsequent chart update
After adding a chart, review Charts. If an update notice appears, regenerate the charts before interpreting the results.
An update is particularly necessary after:
- adding a chart;
- changing postures;
- changing loads;
- adjusting times, repetitions, rest periods, or whether repetitions and rest are included;
- changing model parameters;
- changing Calculate % max. recommended exertion or Include cumulative exertion load in recommended exertion %;
- changing the temporal activity.
Do not draw conclusions from charts that the system identifies as out of date.
Relationship with Charts
New chart is part of the Charts workflow:
- Open Charts from the left-side menu.
- Select + in an available slot.
- Select the chart Type.
- Select the Subtype.
- Select the specific Value.
- Select Add.
- Regenerate or update the charts if requested.
- Interpret the resulting curve in its slot.
Examples
You can create charts showing:
- development of a joint’s exertion or capacity indicator;
- cumulative exertion load when repetitions and rest are included;
- postural discomfort for a body segment;
- REBA score over the activity;
- LUBA score over the activity;
- temporal change in a body angle;
- lumbar compression during the task;
- weight distribution between the left and right supports.
The primary purpose is to locate when maximum values or the most demanding activity phases occur.
Recommendations for use
- First select the general result type.
- Review the available subtypes.
- Finally select the specific variable under Value.
- Add only charts relevant to the analysis.
- Use several slots when variables must be compared.
- Update charts before interpreting the results.
- Select relevant points on a chart to review the corresponding posture in the animation.
If you are unsure which variable to plot, first review the corresponding result dialogs: Exertion, Postural load, Lumbar compression, or Stabilogram.
Related manual sections
- Charts
- Exertion
- Exertion and joint-capacity indicators
- Biomechanical-analysis settings
- Cumulative exertion load
- Lumbar compression
- Postural load
- Postural load: Discomfort
- Postural load: REBA
- Postural load: LUBA
- Stabilogram
- Activity repetitions
Relationship with the Technical foundations
For a fuller methodological explanation of the chartable variables, see:
- Conceptual differences between single-posture and multiple-posture analysis
- Cumulative exertion load in multiple-posture analysis
- Postural discomfort
- Analysis of overexertion risk
- Lumbar compression and shear risk analysis
- Postural-risk assessment using REBA
- Risk assessment for unsuitable postures using LUBA
These sections explain the basis of the variables available in New chart.