Unprotected population
The % unprotected population panel is part of the Exertion window. For each body segment and degree of freedom, it shows the estimated percentage of the population that may not be protected against the exertion required by the analyzed posture or activity.
This result is derived from the estimated distribution of joint capacities in the population and from classification limits based on references used by NIOSH. It is a different assessment method from the exertion or capacity indicators shown in the upper panel of the Exertion window.
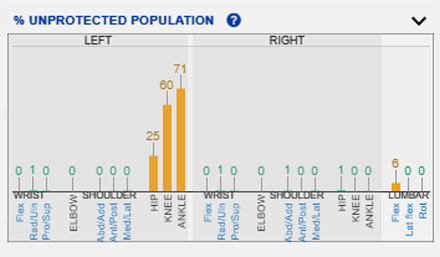
| Element | Function |
|---|---|
| Vertical bars | Represent the unprotected population percentage for each body segment and degree of freedom. |
| Left and right areas | Separate results for the left and right sides of the body. |
| Joint labels | Identify the assessed joint or body segment and degree of freedom. |
| Number above each bar | Shows the estimated unprotected population percentage for that exertion. |
| Color coding | Supports visual interpretation according to the configured protected-population limits. |
What this panel shows
The panel shows the percentage of the population that is unprotected against the biomechanical exertion required by the posture.
Each bar represents a specific movement of a joint or body segment. Its number indicates the proportion of the population that may fall outside the protection level defined by the system.
For example, 0% means that the reference population is protected against that exertion under the applied criteria. A high value, such as 80% or 90%, means that a large proportion of the population may not be protected against the required exertion.
This panel provides a population-level interpretation. It does not mean that a particular person will necessarily be harmed; it means that the exertion exceeds the recommended capacity for a given proportion of the reference population.
Difference from exertion and capacity indicators
The Exertion and joint-capacity indicators panel shows %MRE by default. If Calculate max. recommended exertion (%) is disabled, the result no longer includes the weighting used to set preventive priorities. The indicator name then depends on the operating mode and, in Multiple Postures mode, on whether previous exertion and recovery are included in the recommended capacity.
The % unprotected population panel instead uses the estimated distribution of joint capacities directly to calculate the proportion of the population whose capacity would be lower than the required moment.
The procedures are related because they use the same required moment and the same general joint-capacity equations, but they answer different questions:
- %MRE indicates what percentage of the personalized limit used to establish preventive priorities is represented by the required moment.
- % recommended joint capacity indicates what percentage of the recommended joint capacity under the analyzed conditions is represented by the required moment. In Multiple Postures mode, this capacity may vary according to previous exertion and recovery.
- Percentage of Maximum Isometric Capacity Used indicates how much of the estimated maximum isometric capacity the posture requires, without considering previous activity.
- % unprotected population estimates the proportion of the reference population whose capacity may be lower than the required moment.
The population calculation does not select an individual capacity based on body build, and its result is not changed by duration, repetition, recovery periods, or the options used to display %MRE, % recommended joint capacity, or maximum isometric capacity percentage. Its result may therefore differ from the percentage shown in the upper panel.
A high unprotected-population percentage should be reviewed carefully even when the personalized exertion or capacity indicator is low. The two results provide complementary perspectives: one refers to the specific profile configured for the model, and the other to the estimated distribution of capacities in the reference population.
Effect on the Exertions table
When the % unprotected population panel is selected, the last columns of the Exertions table change to show the population classification.
Column 6, labeled Level, may show:
- ACTION when the Protected Population Percentage is below the configured action limit;
- DANGER when it is below the configured danger limit;
- no label when the percentage remains above the action limit.
Column 7 shows the corresponding symbol: a green check mark, an orange exclamation mark, or a red exclamation mark. Classification uses the Protected Population Percentage and the limits applicable to the sex selected in the model settings.
The mean, standard deviation, and Protected Population Percentage columns retain their values. The epidemiological priority adjustment does not affect this view.
Interpreting the percentage
The value above each bar is the percentage of the population that may be unprotected.
As a general guide:
- values near 0% indicate that the exertion is within a range compatible with a high level of population protection;
- intermediate values indicate that part of the population may not be protected;
- high values indicate that the required exertion may be excessive for a substantial proportion of the population.
In practice, the tallest bars quickly identify the joints or movements that are most problematic from a population-capacity perspective.
Color coding
The bars use color coding to support visual interpretation. The limits are configured as capable or protected population percentages, although the chart displays the complementary unprotected-population value.
Green bars
Green bars mean that the Protected Population Percentage is equal to or greater than the configured action limit.
In this case, the unprotected-population percentage is low or remains within the established reference level.
Orange bars
Orange bars mean that the Protected Population Percentage is below the action limit but not below the danger limit.
This color is a warning. The exertion has not reached the most unfavorable level, but the proportion of unprotected people already warrants review. Check the posture, applied load, and task conditions.
Red bars
Red bars mean that the Protected Population Percentage is below the configured danger limit.
These results identify movements or joints for which the required exertion may be excessive for a large proportion of the reference population. They should receive priority in the ergonomic review.
Default values
The default limits depend on the selected sex:
| Sex | Action level | Danger level |
|---|---|---|
| Male | Less than 99% protected, equivalent to more than 1% unprotected. | Less than 25% protected, equivalent to more than 75% unprotected. |
| Female | Less than 75% protected, equivalent to more than 25% unprotected. | Less than 1% protected, equivalent to more than 99% unprotected. |
These are the initial values. You can replace them with custom limits.
Configurable protected-population limits
The limits used to interpret the unprotected-population percentage are configurable. Changing them changes the color coding and the ACTION or DANGER classification, but not the calculated protected or unprotected population percentage.
To change them, select the gear button at the bottom of the Exertion window. This opens Biomechanical Analysis Settings.
There you can select NIOSH-recommended percentages or define custom capable or protected population limits. See Biomechanical analysis settings for all available controls.
Until these limits are changed, the system uses the default configuration based on NIOSH criteria.
Factors that affect the result
The unprotected-population percentage depends on the required exertion and the population capacity considered.
Factors that may change the result include:
- the model posture;
- the applied load or force;
- distribution of the load between the hands;
- loads applied to other body segments;
- model anthropometry;
- sex;
- age;
- dominant side;
- seated condition;
- stability and supports.
The body build selected to personalize capacity does not change this population percentage. Neither do action duration or repetitiveness, the epidemiological priority adjustment, or its influence value.
The limits selected in Biomechanical Analysis Settings change the result classification and colors, but not the calculated percentage.
Before interpreting a high value, make sure that all these elements accurately represent the actual task.
To review model parameters, see Model settings.
To review loads, see:
Relationship to posture and degrees of freedom
The panel separates the results by body segment and degree of freedom.
This identifies not only the more highly affected side of the body, but also the specific movement responsible for the greatest population exposure. Depending on the joint, the result may be associated with flexion/extension, abduction/adduction, lateral flexion, or rotation.
The panel uses concise operational labels. Interpret them according to the model structure and the type of movement assessed.
To review the posture angles, see Postural information.
Relationship to other Exertion panels
Interpret % unprotected population together with the other panels in the Exertion window, particularly:
- Exertion and joint-capacity indicators
- Biomechanical exertions
- Cumulative exertion load
- Joint loads
- Support reaction loads
The unprotected-population percentage provides a population-level reading, but does not replace review of biomechanical exertion, joint loads, or stability.
Practical interpretation procedure
Use the following sequence:
- Locate the red bars first.
- Review the orange bars.
- Identify the body segment and degree of freedom with the highest unprotected-population percentage.
- Determine whether the result corresponds to an extreme posture, a high load, or a combination of both.
- Review the loads entered for the hands and other body segments.
- Make sure that the model parameters are appropriate for the person or population being analyzed.
- Review the limits configured in Biomechanical Analysis Settings.
- Check the Protected Population Percentage and assigned level in the Exertions table.
- For a time-based activity, also review cumulative exertion load as a complementary result, although it does not affect this population percentage.
Recommendations for use
Keep the following points in mind:
- Do not interpret the result as a direct individual prediction.
- Use the percentage as a population estimate based on capacity criteria.
- Review the configured limits if the results do not match the protected-population criterion you intend to apply.
- Compare the left and right sides to detect asymmetries.
- Review posture and loads before drawing conclusions.
- When comparing alternatives, keep the protected-population limits and model configuration constant.
- Do not attribute changes in this panel to the epidemiological adjustment, influence, or body build, because these parameters do not change the calculated population percentage.
Relationship to the Technical foundations
For a more detailed methodological explanation, see these sections of the Technical foundations:
- Overexertion risk analysis
- Maximum joint capacities
- Exertion assessment
- Exertion assessment according to Protected Population Percentage
- Instantaneous relative exertion
- Recommended maximum voluntary contraction percentage in a single-posture analysis
- Limitations of joint exertion as the sole risk indicator
- Limitations in calculating biomechanical moments and exertions
These sections explain the population distribution of capacities, action and danger limits, differences from personalized exertion and capacity indicators, and the limitations to consider when interpreting these results.