
No has iniciado sesión Regístrate Inicia Sesión
This paper examines the potential use of KinectTM range sensor in observational methods for assessing postural loads. Range sensors can detect the position of the joints at high sampling rates without attaching sensors or markers directly to the subject under study. First, a computerized OWAS ergonomic assessment system was implemented to permit the data acquisition from KinectTM and data processing in order to identify the risk level of each recorded postures. Output data were compared with the results provided by human observers, and were used to determine the influence of the worker's position relative to the sensor. The tests show high inter-method agreement in the classification of risk categories (Proportion agreement index = 0.89 κ = 0.83) when the tracked subject is facing the sensor. The camera’s point of view relative to the position of the tracked subject significantly affects the correct classification of the postures. Although the results are promising, some aspects involved in the use of low-cost range sensors should be further studied for their use in real environments.
Jose Antonio Diego-Masa*, Jorge Alcaide-Marzalb
A Engineering Projects Department, Universitat Politècnica de València, Camino de Vera s/n, 46022, Valencia, Spain. jodiemas@dpi.upv.es
B Engineering Projects Department, Universitat Politècnica de València, Camino de Vera s/n, 46022, Valencia, Spain. jalcaide@dpi.upv.es
*Corresponding author. Tel.: +34 963 877 000. E-mail address: jodiemas@dpi.upv.es (J.A. Diego-Mas)
Highlights...
This paper examines the potential use of Kinect range sensors in observational methods for assessing postural loads.
The results obtained by human observers are compared with those obtained by the sensor.
The influence of the position of the sensor with respect to the tracked user is analyzed.
High agreement exists between the assessment made by human observers and the sensor when the tracked subject stands facing the sensor’s camera.
The orientation of the sensor with respect to the worker affects the sensor’s ability to accurately identify the body positions.
Keywords: Kinect, OWAS, Movement, Posture, Software, Workplace
Low-cost range sensors like Microsoft’s Kinect or ASUS Xtion sensor can be used as 3D motion capture systems, thus being an alternative to more expensive devices. Kinect was initially developed for use in computer games, achieving a natural interaction with the user. Basically it consists of an infrared laser transmitter and an infrared camera. This system is able to determine the distance of objects in the environment. This process and the characteristics of the data collected by Kinect can be consulted in Henry et al., 2012 or Khoshelham and Elberink, 2012.
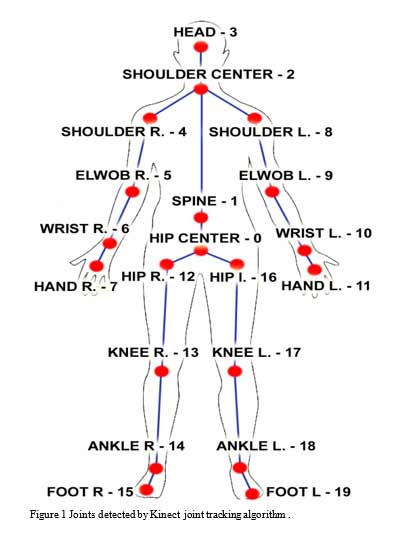
The sensor data can be used in software applications through the use of a software development kit (SDK) (Microsoft, USA). In addition to depth (Depth data) and color data (RGB data), the sensor provides information about the position of the joints of recognized users present in the frame (skeleton data) in close to real time. The information is provided in the form of an array with the coordinates of 20 points. These points are the positions of the center of the major joints of the human body and, in some cases (head, spine, hands and feet), estimations of the center of the major limbs. Pelvic girdle center and shoulder girdle center are called Hip Center and Shoulder Center in the SDK (Bonnechère et al., 2013a) (see Figure 1). The joint centers are obtained from a randomized decision forest algorithm and the data seem to be accurate enough to be used for postural assessment (Bonnechère et al., 2013a; Clark et al., 2012; Dutta, 2012; Martin et al., 2012; Raptis et al., 2011). In this paper we will analyze if these devices can help evaluators that use observational techniques for ergonomic job assessment.
The methods for assessing exposure to risk factors for work-related musculoskeletal disorders (MSDs) can be classified according to the degree of accuracy and precision of data collection and to how intervening the measuring technique is for the work done by the worker (A. van der Beek and Frings-Dresen, 1998; Wells et al., 1997). Observational methods are methods based on direct observation of the worker during the course of his work. They have the advantages of being straightforward to use, applicable to a wide range of working situations and appropriate for surveying large numbers of subjects at comparatively low cost; however these methods use data collection systems that are not very accurate and provide rather broad results. Instrument-based or direct measurement methods employ sensors attached to the subject for measuring certain variables These methods collect accurate data, but are intervening, require considerable initial investment to purchase the equipment, as well as the resources necessary to cover the costs of maintenance and the employment of highly trained and skilled technical staff to ensure their effective operation (David, 2005; Trask and Mathiassen, 2012). Direct methods are preferred by researchers, but are unsuitable for use in real work situations (Li and Buckle, 1999).
Regarding the methods for assessing postural load, some observational methods collect data at set time intervals to make an estimate of the overall worker’s exposure to MSD risk factors. Observations are often made on categories of exposure, and the proportion of time recorded for each exposure category is the ratio of the number of observations recorded for the category to the total number of observations. Unlike direct methods, observational methods have limitations in the sampling rates. Many studies have analyzed the degree of validity of the sampling rates and have compared their results with those of direct measurement methods; however these studies greatly differ in their conclusions (Alex Burdorf et al., 1992; Juul-Kristensen et al., 2001; V. L. Paquet et al., 2001; Spielholz et al., 2001).
Click Figure to enlarge
Figure 1:
Joints detected by Kinect joint tracking algorithm.
To facilitate the implementation of observational methods workers activities are recorded by video or photographs. Afterwards, the exposure can be observed from a monitor with the opportunity to use slow motion and to review the images. An observer can register a limited number of postural variables reliably (Doumes and Dul, 1991; Genaidy et al., 1993), therefore, observations of occupational activities can best be joined with data from video observation (A. van der Beek and Frings-Dresen, 1998; Coenen et al., 2011). However, the use of photographs or videos in the observational methods also presents drawbacks. For example, in the measurement of angles, the location of the camera must be chosen with care to avoid distortion due to the camera’s field of view (Doumes and Dul, 1991). Sometimes certain angles can be properly measured from one field of view, but other angles are distorted and would require the recording of simultaneous images from different fields of view (Knudson and Morrison, 2002). When the subject is located within the field of view of the camera the errors in the analysis of postural angles from a video or a photograph are small; however changes in the position of the worker with respect to the camera lead to measurement errors (Genaidy et al., 1993), and may affect the results. Additionally, when the worker is performing dynamic tasks the observations can be less reliable or even invalid (DeLooze et al., 1994) because serious information bias may occur in exposure data on working postures.
The observational methods based on time sampling analyze postural duration as a risk factor which is measured as the relative frequency of occurrence of each risk category (level of risk). However, the analysis of frequency, or time variation of risk, requires the use of devices with high sampling rates (A. van der Beek and Frings-Dresen, 1998). Some studies have addressed this issue using techniques such as computer vision (Pinzke and Kopp, 2001). Thus, although the validity of the results of the observational methods for the assessment of postural load is supported by many studies, data collection inaccuracy and low sampling rates are the biggest drawbacks of these methods. The use of low-cost range sensors like Microsoft's Kinect could be useful in the collection of data at very high frequencies, but it is necessary to check the accuracy and reliability of the data collected. Previous studies have analyzed the ability of Kinect for use as a 3D motion capture system in working environments, concluding that the sensor accuracy is only slightly lower than that of more expensive devices, but reliable enough for use in ergonomic assessment of work stations (Clark et al., 2012; Dutta, 2012).
In the present work we have used a low-cost range sensor (Microsoft's Kinect) for data collection, following which an observational method was used to assess postural load (OWAS). The aim is to determine the suitability of the device to collect the information requested by the method, and compare the results with the observations made by human observers using photographs or videos. The use of low-cost range sensors maintains all the benefits of observational methods and it does not increase the cost of application, since the low initial investment required to purchase the equipment (149 € in Spain in 2012) is offset by the shorter time needed for data processing (Trask and Mathiassen, 2012). They are also easy to use, do not require complex calibration processes and do not affect the work process. All these factors make practitioners prefer observational methods to direct measurement techniques.
Another objective of this work is to test the reliability of the assessment when the worker is not facing the sensor. It is known that the capacity of the sensor to precisely detect the joints position greatly decreases in this situation (“Natural User Interface for Kinect for Windows,” 2013). The results of this work will show that this is an important drawback in using Kinect to assess postures in a real work environment.
To conduct the present study we selected the OWAS method (Ovako Working Posture Analysis System) (Karhu et al., 1977). Unlike other postural assessment methods like RULA (McAtamney and Nigel Corlett, 1993), REBA (Hignett and McAtamney, 2000) or LUBA (D Kee and W Karwowski, 2001) which analyze individual body segments, OWAS makes multiple observations of the posture of the worker during work. OWAS has been applied to a wide range of industries (Pinzke, 1992). A significant relationship between the back postures as defined by OWAS and prevalence in lower back pain has been established by epidemiological analysis (A Burdorf et al., 1991). In the following sections, the OWAS method is briefly presented and the procedure followed to transform the data provided by the sensor so that it can be used by the method is described. Then the results obtained are compared with those obtained by human observers and finally the main conclusions are summarized.
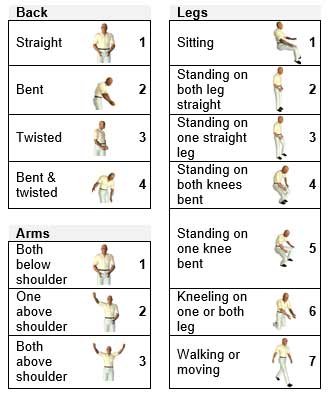
OWAS method can estimate the static load of the worker in the workplace by analyzing the worker’s postures during work. The system identifies the positions of the back, shoulders and legs of the worker and the weight of the load handled. The evaluator makes observations at regular intervals of 30 to 60 seconds coding each posture according to the digits shown in Figure 2, and an additional fourth digit depending on the load handled by the worker. Therefore, each body posture is coded by four digits corresponding to the back, shoulders, legs and load in this order. Based on the body position code OWAS identifies four classes which reflect static load risk degree (Mattila and Vilki, 1999). Class 1: Normal posture. No intervention required. Class 2: Slightly harmful. Corrective action should be taken during next regular review of working methods. Class 3: Distinctly harmful. Corrective action should be taken as soon as possible. Class 4: Extremely harmful. Corrective action should be taken immediately.
OWAS method assesses postural load for each of the body parts considered, depending on the time that individuals spend in different postures during the course of their working day. The relative amount of time of each posture over a working day (or period analyzed) is calculated from the frequency of occurrence of each posture compared to the total number of postures recorded during the sampling process. In this way, the system can calculate the percentage of occurrence of each position of back, arms and legs. As this percentage increases the worker’s postural load is greater, and consequently the priority and urgency for ergonomic intervention and corrective action.
The real proportion of time in each posture is estimated from the observed postures. Therefore, the estimation error decreases as the total number of observations increases. The limit for this error (with 95% probability) based on 100 observations is 10%. The error limits based on 200, 300 and 400 observations are 7%, 6% and 5% respectively (Louhevaara and Suurnäkki, 1992; Mattila and Vilki, 1999). The values obtained through observations can be considered reliable when the error limit is below 10%.
Click Figure to enlarge
Figure 2:
Definition of codes for back, arms and legs in the OWAS method.
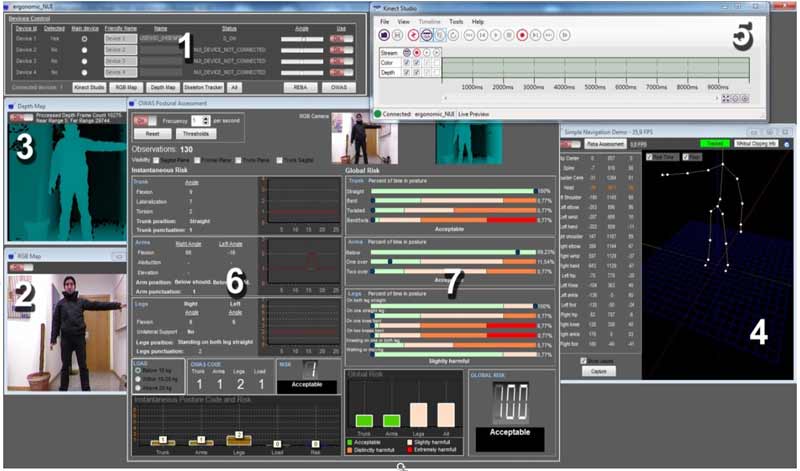
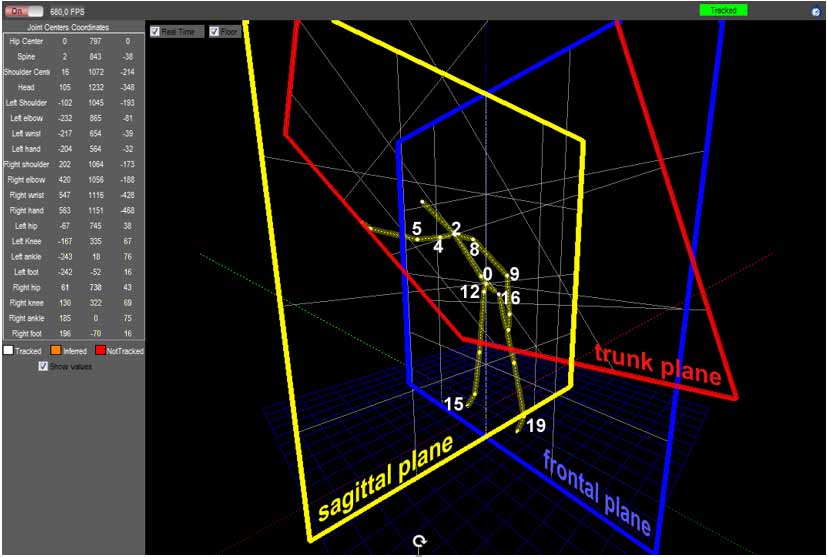
Delphi XE was used to develop a software application (ergonautas-NUI) for the retrieval and processing of the data provided by the Kinect sensor (Figure 4).The software could be freely downloaded from ergonautas.com (https://www.ergonautas.upv.es/lab/kinect/). The free Microsoft Kinect Software Development Kit was used as the interface with the sensor. For the geometrical calculations and graphical representation GLScene, a free OpenGL based 3D library for Delphi was used.
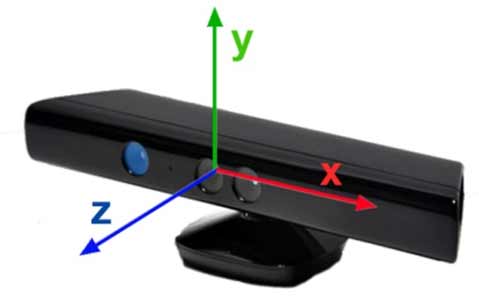
ergonautas-NUI can retrieve and process data from up to four different sensors simultaneously, representing the RGB Map and the Depth Map (numbers 2 and 3 in Figure 4). The Depth Map is processed by Kinect that calculates the positions of the joints of recognized users present in the frame, transforming the coordinates into an array of data. The x, y, and z-axes are the axes of the depth sensor (Figure 3). This is a right-handed coordinate system that places a Kinect at the origin with the positive z-axis extending in the direction of the sensor’s camera. The positive y-axis extends upward, and the positive x-axis extends to the left (“Natural User Interface for Kinect for Windows,” 2013). To facilitate the display and processing of the data, ergonautas-NUI automatically transforms all the coordinates so that the foot located below (joints 15 or 19 in Figure 1) coincides with the ground (coordinate y = 0), and the hip center is always held in a vertical axis with coordinates x = z = 0. It is necessary to remark that hip center is the joint 0 shown in Figure 1, and it does not represent the true anatomical hip joint center. The modified skeleton joint position data is displayed in real time (number 4 in Figure 4). RGB Map, Depth Map and skeleton data can be recorded, stored and re-processed by ergonautas-NUI (number 5 in Figure 4) using Kinect Studio.
A tracked joint that is not visible to the camera is inferred by Kinect sensor. That is, the joint position is calculated from surrounding joint data rather than being directly captured by the camera (“Natural User Interface for Kinect for Windows,” 2013). The software developed allows the operator to decide whether to use or discard the postures in which the position of a joint has been inferred.
ergonautas-NUI records the skeletal tracking joint information at regular time intervals. The sampling rate can be regulated by the evaluator between 25 seconds and one hour. The data collected is processed to obtain the codes for each body posture and risk action level (number 6 in Figure 4). The procedure followed for data processing is described in the next section. The frequency values of the postures recorded are used to calculate the percentage of time spent in each position for each body part and its associated action level, (number 7 in Figure 4).
The information about the coordinates x, y and z of the joints of the tracked subject is obtained from the sensor in the form of an array with three columns (one for each coordinate) and 20 rows. Each row corresponds to a joint in the order shown in Figure 1. To get the postural risk level it is necessary to classify the positions of the back, shoulders and legs. The process begins by calculating three auxiliary planes (sagittal, frontal, trunk) (Figure 5). The sagittal plane is obtained as the plane perpendicular to the straight line connecting the left and right hip (12 and 16) and passing through the hip center (0). The frontal plane is calculated as a vertical plane which passes through both hips (12 and 16). The trunk plane is determined as the plane passing through the hips and neck (12, 16 and 2). These planes are calculated for each tracked posture..
- BACK
To identify the position of the back it is necessary to calculate the angles of flexion, lateral bending and trunk rotation. The trunk flexion angle is calculated by projecting the neck (2) on the sagittal plane and measuring the angle between the line connecting this point and the hip (0) with a vertical line. Although the OWAS method does not indicate from what angle the trunk can be considered to be flexed, it may be assumed to occur at angles greater than 20° (Mattila and Vilki, 1999). For the calculation of lateral bending the line connecting the shoulders (4 and 8) is projected on the trunk plane, measuring the angle formed by this line and the line connecting the hips (12 and 16). Trunk rotation is measured by calculating the angle between the line joining the shoulders and that same line projected on the trunk plane.
- ARMS
To determine if the arms are above or below the shoulders the y coordinates of the elbows (5 and 9) are compared with those of the shoulders (4 and 8).
- LEGS
The position of the legs is classified depending on whether there is bilateral support and on the bending angle of each leg. To find out if both feet are flat on the ground the y axes of the feet (15 and 19) are compared. If the difference is greater than a certain threshold value set by the evaluator the observed subject is considered to rest on one leg (the threshold used in this work was 30 millimeters). The bending of the legs is calculated by measuring the angle formed by the line connecting the hip to the knee and the line connecting the knee to the ankle. The postures of the worker can be classified depending on the bending angles of the legs and whether both feet are flat on the ground. Furthermore, to determine if the worker is walking, the position of the hip (0) is measured at regular intervals of time. If the travel speed exceeds a threshold value set by the evaluator the worker is considered to be moving.
- LOAD
Load handling cannot be determined from the sensor’s data. Although some algorithms allow the system to detect load handling by attaching markers to the load, we decided that the evaluator could input this information directly into the system. The evaluator selects the correct option (less than 10 kg, between 10 and 20 kg or more than 20 kg) at the appropriate time. This does not become a problem provided the worker always handles loads in the same interval.
Although Kinect provides a simple way to obtain depth maps and depth images at a rate of up to 30 frames per second, data processing is time consuming. Yet the speed of posture data acquisition and assessment can reach 25 observations per second on a desktop PC with a 3.4 GHz processor and 4GB RAM.
Click Figure to enlarge
Figure 3:
Coordinate system of the depth sensor.
Click Figure to enlarge
Figure 4:
Software developed for retrieval and processing of KinectTM data. 1: Sensor control Unit. 2: RGB Map. 3: Depth Map. 4: Skeleton Data. 5: Recording-replay unit. 6: OWAS posture assessment. 7: Calculation of relative frequency values and overall posture assessment.
Click Figure to enlarge
Figure 5:
ergonautas-NUI Skeleton Tracker showing auxiliary planes: sagittal, frontal and trunk.
Click Figure to enlarge
Figure 6:
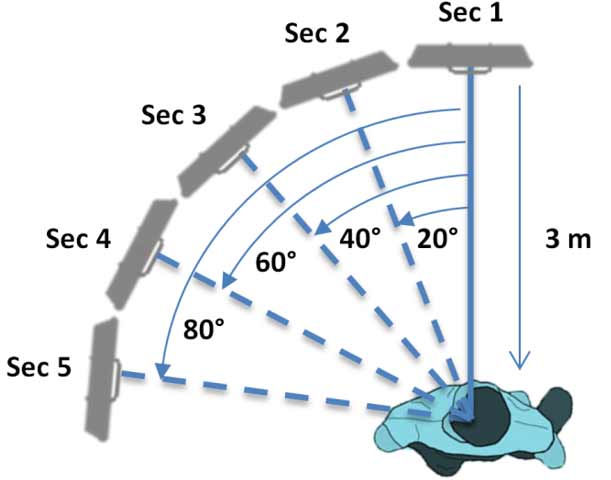
Location of the sensor for each motion sequence recorded.
The result of the postural load assessment obtained with Kinect was compared with the results obtained by human observers using the recorded images. The analysis was also used to determine how the orientation of the worker with respect to the sensor affected the results. It is known that the Skeleton Tracking algorithm for Kinect works better when the users are facing the sensor (“Natural User Interface for Kinect for Windows,” 2013). The reliability of the joints positions diminish quickly when the angle between the sensor and the observed subject sagittal plane increases. This is an important drawback in using Kinect to assess postures in a real work environment. In order to test this problem several sensor orientations were used in this work. Although multiple sensors covering different orientations can be used simultaneously this tends to decrease the accuracy of the system in detecting body positions. The emitter of each sensor projects a speckled pattern of infrared light in the detection area. If more than one sensor is used simultaneously their patterns interfere affecting posture detection ("Natural User Interface for Kinect for Windows," 2013). For this reason we decided not to record the same sequence of movements using several sensors with different orientations with respect to the worker. Instead, we designed a sequence protocol of movements that a player had to follow in front of one sensor, changing from one posture to the next at set time intervals and without handling a load. The postures adopted by the player of the sequence could be categorized in 55 of the 72 possible classifications of OWAS (sitting postures and variable loads are not considered in this work). The remaining 17 posture classifications that are not present in the sequence are very improbable and unstable, (e.g., standing only on one knee bent with both arms above the shoulder and back bent and twisted), therefore this kind of postures was not adopted in the used sequence of movements. The total duration of the motion sequence was about 196 seconds. The subject performed the sequence of postures 5 times at different angles relative to the sensor (0°, 20°, 40°, 60° and 80°), i.e. varying the angle between the sagittal plane and the sensor (Figure 6). We called each of them with the word Sequence and the corresponding angle, i.e. Sequence 0º, Sequence 20º… The distance between the sensor and the player was, in all cases, 3 meters. In order to play the sequence of movements always in the same way, we showed each posture to the player in a screen. Each posture was shown at the right moment. The sequences of movements were recorded using Kinect Studio. This software can record and play back depth and color streams from a Kinect, creating repeatable scenarios for testing, and analyze performance.
The Kinect for Windows SDK provides a mechanism to smooth the joint positions in a frame. The skeletal tracking joint information can be adjusted across different frames to minimize jittering and stabilize the joint positions over time. The smoothing process is controlled by four parameters that can be tuned using ergonautas-NUI:
ergonautas-NUI records the skeletal tracking joint information at regular time intervals. The sampling rate can be regulated by the evaluator between 25 seconds and one hour. The data collected is processed to obtain the codes for each body posture and risk action level (number 6 in Figure 4). The procedure followed for data processing is described in the next section. The frequency values of the postures recorded are used to calculate the percentage of time spent in each position for each body part and its associated action level, (number 7 in Figure 4).
• Smoothing: Its value must be in the range [0,1]. Higher values indicate high smoothing. The double exponential smoothing method is used for smoothing the data. The location of a body part is based on the location of the previous known location and the current raw location of this body part.
• Correction: Values must be in the range 0 through 1.0. It determines how quickly previous known location of a body part match current raw data. Lower values are slower to correct towards the raw data and appear smoother, while higher values will correct toward the raw data more quickly.
• Prediction: Sets the number of frames to predict the data in the future. New raw data is adjusted to the predicted values of previous captured frames.
• JitterRadius: Any jitter beyond the scope of this parameter during one time step is clamped to the jitter reduction radius.• MaxDeviationRadius: Is the maximum radius in meters that filtered positions are allowed to deviate from the data obtained.
Experimentation is required on an application-by-application basis in order to provide the required level of filtering and smoothing (Azimi, 2013). Therefore a preliminary analysis was carried out to determine which combination of parameters was better suited for our study. Data filtering was necessary for the accurate determination of the positions of the body. The removal of jitter is important and, although the reaction time also needs to be high enough, it was seen that some latency does not affect results for observation frequencies below 5 per second. Based on our early small experiments the parameters used were Smoothing 0.6, Correction 0.2, Prediction 0.5, JitterRadius 0.1 and MaxDeviationRadius 0.1.
The recorded motion sequences were played back with Kinect Studio, and the data were analyzed with ergonautas-NUI. Observation frequency was set at 4 frames per second, recording between 756 and 797 observations at each motion sequence. For each sequence ergonautas - NUI determined the number of postures in each type of risk, OWAS risk indicator and the number of inferred postures, i.e. the number of postures in which some essential body joint to determine the posture code was not visible and therefore its position was inferred.
For the comparison analysis of results obtained using Kinect and by human observation two experts in OWAS method analyzed the images of the 784 postures at Sequence 0°. The experts independently classified each posture into a risk category. The postures that the experts classified in different manners were then analyzed again to reach a consensus on the score. Sequence 0° was chosen as a standard because Skeleton Tracking works best when the tracked user is facing the sensor (“Natural User Interface for Kinect for Windows,” 2013).
In the analysis of Sequence 0 ° the experts did not coincide in the classification of 114 postures. The proportion of the total number of observations in which both experts agreed (Po) was 0.85. In general, discrepancies occurred in postures in which the tracked subject was performing a movement, which involved a change in the classification of the posture. For example, in a movement in which the subject lifts an arm the classification of the position of the arms changes when the elbow reaches the level of the shoulder. If the observation is made at that moment there is some ambiguity about the category to which the posture belongs. After jointly analyzing the 114 postures the experts came to an agreement about the category they fell into.
In Sequence 0° there were about 212 observations (27.04%) in which the position of one body part (back, arms or legs) was incorrectly classified by Kinect, i.e. the OWAS code position assigned differed from the one assigned by experts. The errors detected were due to incorrect codification of the position of the back in 34 postures (4.34%), arms in 40 postures (5.10%) and legs in 164 postures (20.92%). 26 observations had errors in the codification of two body members. The risk category of each posture was correctly classified by the sensor in 88.77% of cases. That is, 88 postures were categorized into an incorrect postural risk category. Although a body part can be incorrectly coded the posture may fall into the right risk category. Thus, while the position of some body parts was incorrectly coded in 212 postures, in 124 cases this error did not involve a wrong risk category classification.
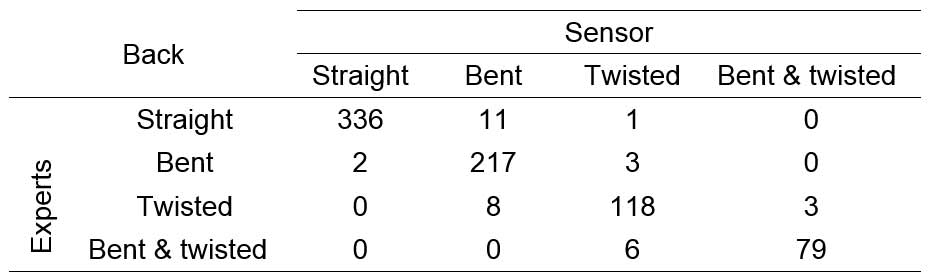
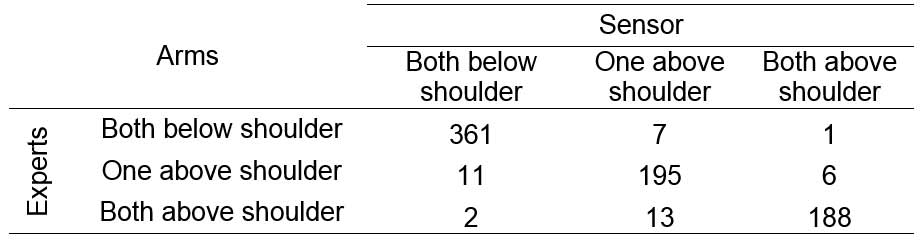
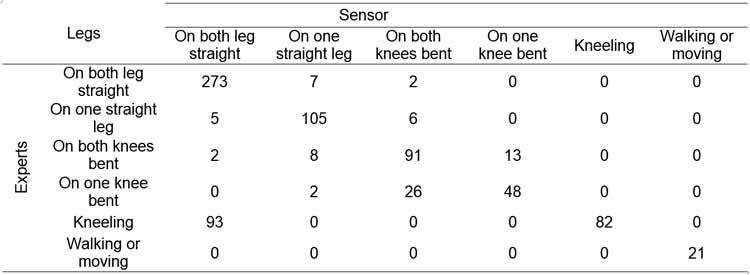
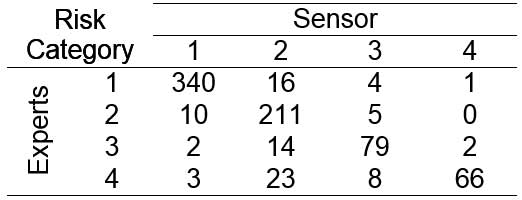
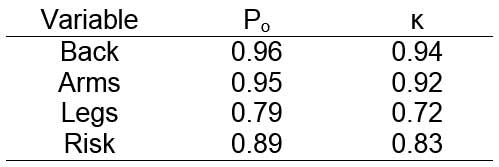
Two-dimensional contingency tables of experts’ observations and Kinect observations are shown in Tables 1, 2, 3 and 4. The Proportion agreement index (Po) and the strength of agreement on a sample-to-sample basis as expressed by Cohen's κ are shown in table 5.
In this study the recordings from the experts were used as a standard and compared with the observations of a low-cost range sensor. Inter-observer and intra-observer agreements in the application of OWAS by human observers have been studied in other works (De Bruijn et al., 1998; Karhu et al., 1977; Dohyung Kee and Waldemar Karwowski, 2007; Kivi and Mattila, 1991; Mattila et al., 1993); this issue was beyond the scope of the present work. Our aim was to determine the degree of similarity between the observations agreed upon by human evaluators and those obtained by Kinect. This sensor performs better when the subject is facing the sensor; therefore we also studied how the orientation of the camera can affect data collection. For this purpose, a subject performed a sequence of postures 5 times facing the sensor located at different angles relative to the sagittal plane of the subject (0 °, 20 °, 40 °, 60 ° and 80 °). Although we tried to keep duration and speed of the movements constant, the total length of the sequences was slightly different, varying between 189 and 199 seconds. This meant that the number of observations in each sequence was different and consequently comparisons between the different positions of the sensor could be somehow affected..
The comparison of results of Sequence 0º obtained by human evaluators and the sensor reveals a high inter-method agreement in the categorization of the postures (Po = 0.89, κ = 0.83). The proportion agreement indexes for the classification of the position of body parts is very high in the case of the back (Po = 0.96 κ = 0.94) and arms (Po = 0.95 κ = 0.92) and lower in the case of the legs (Po = 0.79, κ = .72). Table 3 reveals that the sensor does not work well when the tracked user in kneeling. About 53.14% of the postures in which the subject was kneeling the position of the legs were classified as "Standing on both legs straight". This could happen because when the tracked subject is facing the sensor, his lower legs are hidden by his upper legs. Therefore in this position the sensor confuses the knees with the feet, determining that the subject is standing on both legs straight. Similarly, when the subject stands on a single bent leg the posture is classified as "Standing on both knees bent" in 34.21% of cases.
Although 212 postures had errors in the coding of the position of its body parts, in 124 cases this error did not involve a change in the risk category of the posture. A more detailed analysis of the incorrectly coded postures reveals that they correspond to postures recorded while the tracked subject was performing a movement that caused a change in the coding of the position of one body member. For example, in a movement in which the subject lifts an arm, the code of the arm position changes when the elbow reaches the level of the shoulder. If the recording is taken at that moment there is some ambiguity about posture coding. These errors have little effect on the overall postural load risk since they tend to compensate each other. For example, if the error occurs when the subject raises his arm, it will be compensated by the opposite error when the subject lowers his arm again.
Of the 212 postures that were incorrectly coded in Sequence 0º, 70 correspond to inferred postures. The percentage of incorrectly coded postures is 42.17% in the case of inferred postures versus 22.98% in non-inferred postures. This means that error probability is higher in inferred than in non-inferred postures. The number of inferred postures over the total number of observations increases at high angles between the individual sagittal plane and the sensor (see Figure 7), thus leading to higher error values. The software developed allows the evaluator to decide whether to use the postures in which the position of a joint is inferred for the calculation of risk level. To check the appropriateness of using or not using inferred observations in the calculation of risk, the analysis of Sequence 0 ° was repeated but this time discarding inferred observations and comparing the results with previous calculations. The analysis was then performed on the remaining 618 postures. The classification of postures of Sequence 0 º made by human observers was: Risk 1 (46.05%), Risk 2 (28.83%), Risk 3 (12.37%) and Risk 4 (12.76%). The resulting classification of postures with Kinect using inferred observations was: Risk 1 (45.28%), Risk 2 (33.67%), Risk 3 (12.24%) and Risk 4 (8.80%). Finally, discarding inferred postures, the results were: Risk 1 (56.15%), Risk 2 (27.51%), Risk 3 (11.65%) and Risk 4 (4.69%). This shows that posture distribution in the different risk levels changes, obtaining a substantial increase in the percentage of positions in Risk 1 when inferred postures are discarded. This could be because the other risk levels include postures that are more likely to occlude a body part, and that are consequently inferred by the skeleton tracker. Thus, eliminating the inferred postures from the risk analysis in Sequence 0º leads to greater misclassification than that obtained by considering the inferred postures.
Click Figure to enlarge
Figure 7:
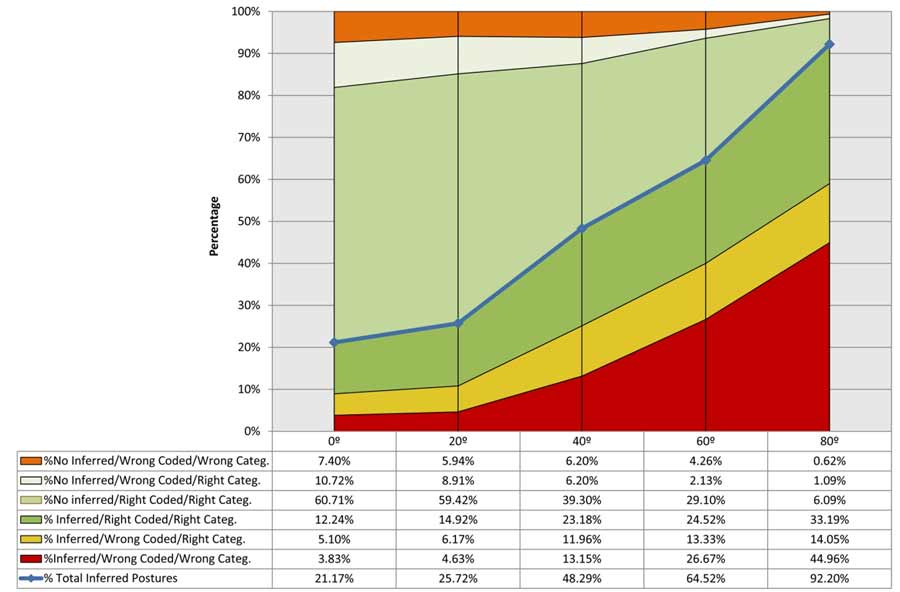
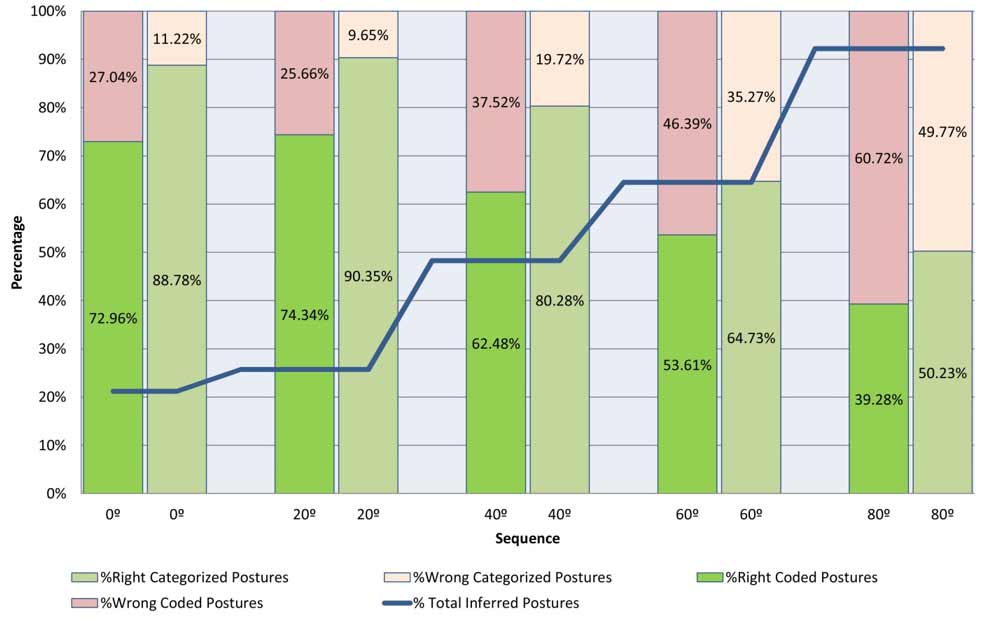
Estimated percentages of right and wrong coded and categorized postures for inferred and no inferred observations in each sequence (Sequence 0º percentages are real, not an estimate).
Click Figure to enlarge
Figure 8:
Estimated percentage of right and wrong coded and categorized postures in each sequence (Sequence 0º percentages are real, not an estimate).
As can be seen in Figure 7, the number of inferred observations significantly increases from angles of 20º. When the tracked subject is facing the sensor, in 21.17% of the postures a body part is not visible for the sensor and it has to be inferred. From 20º this percentage increases rapidly up to 92.20% for angles of 80°. These results are consistent with the fact that the Skeleton Tracking algorithm for KinectTM works better when the users are facing the sensor (“Natural User Interface for Kinect for Windows,” 2013). The number of observations in each sequence of movements differs slightly and the human experts only analyzed the observations of Sequence 0º; therefore, it is not possible to directly compare the rest of sequences with the experts’ opinion. We know from the analysis of Sequence 0º that inferred postures are more likely to be misclassified. Therefore, the bigger percentage of inferred postures in the rest of sequences may increase the number of errors. Moreover, when the angle between the sensor and the sagittal plane of the observed worker increases, the differences between an inferred posture and the real posture could be bigger, and this could increase the percentage of inferred postures wrong coded. On the other hand, the percentage of wrong coded postures among no inferred postures could be different too. To test these possibilities we randomly took a sample of 50 inferred observations and 50 correctly detected observations from each sequence. We analyzed each of the 400 postures checking if it was correctly coded and correctly classified into a risk category, obtaining the results shown in Figure 7 and Figure 8.
In Figure 7 the estimated percentages over the total number of observations of right and wrong coded and right and wrong categorized postures are shown for each sequence. It must be remembered that although a body part can be incorrectly coded the posture may fall into the right risk category. From these data, it could be seen that the percentage of inferred observation wrong coded increases when the angle between the sensor and the sagittal plane of the observed worker increases. A chi-squared test was performed to determine whether or not there were significant differences amongst the proportions. Since the obtained P-value was 0.016 there are significant differences between the samples at the 95% confidence level. Therefore, it could be supposed that the differences between inferred postures and real postures are bigger when the angle between the sensor and the sagittal plane of the observed worker increases, and that this causes an increase of the percentage of inferred postures wrong coded. The same analysis performed over the no inferred observations shown that there are no significant differences between the percentages of right and wrong coded postures at the 95% confidence level (P-value = 0.919). Therefore, the error rate in coding no inferred positions does not seem to vary with the angle.
Figure 8 shows the estimated total percentages of right coded and right categorized postures. The results show that the percentage of right categorized postures in an OWAS risk category using Kinect is over 80% when the angle between the sagittal plane of the worker and the sensor is lower than or equal to 40°. Higher angles result in higher error values up to 50% for angles of 80°. It must be remembered that an analysis of the incorrectly categorized postures reveals that many of them correspond to postures recorded while the tracked subject was performing a movement that caused a change in the coding of the position of a body member, and that these errors have little effect on the overall postural risk since they tend to compensate each other.
Therefore, although the results are promising, there are still certain aspects relative to the use of low-cost range sensors in real working environments that need further research. Kinect could be a good skeleton tracking system when the subject is facing the sensor or is in the range of ± 40°. Otherwise data reliability decreases significantly. This is a significant drawback in cases where the tracked user assumes postures with different orientations with respect to the sensor. Moreover, in real scenarios it is common to find objects that prevent the sensor from properly monitoring some body parts of the tracked user to the sensor. Something similar happens when the worker handles large objects that make it difficult for the camera to detect certain parts of the body. This problem can be solved using multiple sensors oriented at different angles relative to the tracked subject. However, as mentioned above, the simultaneous use of several sensors causes interference between speckled patterns and makes it difficult for the sensor to detect the positions of the body (“Natural User Interface for Kinect for Windows,” 2013). Furthermore, only one sensor can report skeleton data for each process. However, it is possible to know when a sensor has a poor vision of the worker and then sequentially switch other sensors on and off. During application execution, it is then possible to change which sensor is actively tracking skeletons until the system gets an acceptable field of view (Webb and Ashley, 2012).
In the present study we did not analyze sitting positions or automatic load detection. OWAS method considers 3 weight ranges (less than 10 kg, 10 to 20 kg and more than 20 kg). Automatic load detection would be desirable if the load handled by the worker greatly varies over the course of his work. Future research may consider attaching markers to the load, and using the depth sensor and video camera data to track these additions and achieve automatic load detection (Clark et al., 2012; Ong et al., 2008).
Finally, nowadays, Kinect system is not able to assess internal/external joint rotations in the peripheral limbs. Another main drawback of the Kinect skeleton is in a very non-anthropometric kinematic model with variable limb lengths. Although this does not seem to be a problem for ergonomic assessment by OWAS and others applications where less information is needed (Obdrzálek et al., 2012) , the use of other methods such as RULA, REBA, LULA or PATH (Buchholz et al., 1996) requires to measure joint rotations and an improved kinematic model. Microsoft recently announced the launch of Kinect 2. Among other features, the new version can detect joint rotations. On the other hand, new improved anatomical models are being developed for Kinect™ (Bonnechère et al., 2013b), and could be used for assessing postural load by other methods.
The analysis presented in this work suggests that low-cost range sensors can be a useful tool for the collection of data for use in observational methods for the assessment of postures, although further research is needed in order to use them in real work environments. These devices automatically record body positions at high sampling frequency, thus providing accurate and reliable estimates of frequency and duration of risk exposure. Its use has advantages over camera systems that define joint centers and anatomical landmarks based on markers placed on the skin (setup time required, uncomfortable exposure of areas of the body such as the thorax, hips and thighs…) (Clark et al., 2012).
However, the application of these devices requires overcoming problems such as lack of accuracy when the tracked subject is not facing the sensor or when a part of the body is not visible to the camera. Nowadays range sensors can be used like a tool to support the ergonomists tasks, but its technology is not enough developed to replace the assessment by human expert.
Diego-Mas, J.A.; Alcaide-Marzal, J. 2014. Using Kinect™ sensor in observational methods for assessing postures at work. Applied Ergonomics, 45 (4), pp. 976–985.

Ergoniza