

Estimation of thermal comfort
Lack of thermal comfort is a major ergonomic risk factor closely linked to the development of musculoskeletal disorders. For a situation to be considered thermally comfortable, it must allow the physiological mechanisms responsible for thermoregulation to achieve thermal balance. This means that the body can balance the heat gained from metabolic sources or the environment and the heat eliminated through various processes.
However, thermal balance alone does not guarantee comfort. The human body can achieve thermal balance in uncomfortable situations, so assessing comfort requires considering other environmental factors. For example, the amount of sweat excreted and skin temperature must be within specific limits for comfort. Additionally, comfortable conditions depend on the activity being performed, as the required amount of evaporated sweat and skin temperature may vary.
Many methods attempt to evaluate thermal comfort in various situations, but they often overlook critical variables in industrial settings, such as radiant heat and workload intensity. This limits their usefulness in the workplace.
P.O. Fanger (Thermal Comfort, McGraw-Hill, 1973) developed a method that accounts for the different variables influencing thermal environment assessments in work settings. Fanger's method considers activity level, clothing characteristics, dry temperature, relative humidity, mean radiant temperature, and air velocity, which all affect the thermal exchanges between humans and their environment, affecting comfort sensation.
Fanger's method is now one of the most widely used for estimating thermal comfort. It calculates two indices: Predicted Mean Vote (PMV) and Predicted Percentage of Dissatisfied (PPD). These indices indicate the average thermal sensation of an environment and the percentage of people likely to feel uncomfortable in a specific setting. This information is valuable not only for evaluating existing situations but also for designing or modifying thermal environments. The method's importance and widespread use are evident in its inclusion in ISO 7730, which relates to the evaluation of the thermal environment.
Remember...
The basic condition for Thermal Comfort to exist is that the physiological mechanisms responsible for thermoregulation achieve thermal balance, meaning, the body must be able to balance the heat gained and the heat eliminated.
Other variables that influence Thermal Comfort are: activity level, clothing characteristics, dry temperature, relative humidity, mean radiant temperature, and air velocity.
Remember...
Fanger's Method calculates two indices:
The Predicted Mean Vote reflects the average value of the votes given by a large group of people concerning a given situation on a 7-level thermal sensation scale.
The Predicted Percentage of Dissatisfied is the percentage of those people who would consider the thermal sensation caused by the environment to be unpleasant.
The Predicted Mean Vote (PMV) is an index representing the average value of votes from a large group of people regarding a specific situation on a 7-level thermal sensation scale (very cold, cool, slightly cool, neutral, slightly warm, warm, and very warm). This scale is based on the thermal balance of the human body, which is the difference between the body's internal heat production and its loss to the environment.
While the PMV predicts the average thermal sensation value, individual votes will be distributed around that average. Therefore, it is helpful to estimate the Predicted Percentage of Dissatisfied (PPD) to account for those feeling too cold or hot and considering the environment unpleasant.
Fanger's method allows for the evaluation of the overall thermal sensation in a specific thermal environment by calculating the PMV. Additionally, determining the PPD helps predict the percentage of people who will find the situation uncomfortable.
To apply Fanger's method in assessing the thermal comfort of a particular environment, follow these steps:
In the following sections, we will detail how to proceed with some of these steps.
Remember...
... the units commonly used for metabolic rate calculations are met and W/m². The following table shows their equivalences:
1 Kcal 4,184 KJ 1 Kcal/h 1,161 W 1 W 0,861 Kcal/h 1 Kcal/h 0,644 W/m² 1 W/m² 1,553 Kcal/hour (*) 1 met 0,239 Kcal 1 met 58,15 W/m² (*) for a standard body surface area of 1.8 m²
Remember...
... the units for measuring clothing thermal insulation are clo, or clothing index, and square meter kelvin per watt (m²K/W).
As an example of the typical range of insulation values, light clothing (for summer) provides 0.5 clo, a full suit 1 clo, and a winter military uniform 1.5 clo.
In any case, it is necessary to consider certain limitations in the applicability of Fanger's method. According to the recommendations of ISO 7730 "Ergonomics of the thermal environment," the Predicted Mean Vote (PMV) index should only be used to evaluate thermal environments in which the variables involved in the calculation remain within the following ranges (equivalent to thermal environments between cool (-2) and warm (2)):
Metabolic rate between 46 and 232 W/m² (between 0.8 met and 4 met).
Clothing insulation between 0 and 0.31 m² K/W (0 clo and 2 clo).
Air temperature between 10°C and 30°C.
Mean radiant temperature between 10°C and 40°C.
Air velocity between 0 m/s and 1 m/s.
Water vapor pressure between 0 and 2700 Pa.
The method is specially designed for the study of stationary environmental conditions, although it provides a good approximation for small variations in the conditions under study by using time-weighted average values (specifically in the preceding hour).
To apply the method, it's necessary to determine the insulation provided by everyday clothing or work clothing. Determining the exact insulation of garments can be complex, so estimating insulation is more convenient. Various procedures, such as those outlined in ISO 7730 and ISO 9920 standards, can help estimate insulation.
These tables enable the calculation of clothing's thermal insulation based on common garment combinations or a customized selection of garments comprising the worker's outfit. Furthermore, if the activity occurs in a seated position, the insulation provided by the seat can be added to the calculated clothing insulation.
Clothing's thermal insulation is measured in clo units and square meters kelvin per watt (m²K/W). To obtain the Predicted Mean Vote, the clothing insulation value measured in m²K/W is needed. If the measurement is in clo units, use the following conversion: 1 clo = 0.155 m²K/W.
Ergoniza's Fanger method software can calculate clothing insulation using various procedures. You can also use Ergoniza's AIS tool. In any case, Table 1 can guide the evaluator on the range of values the clothing's thermal insulation variable may have.
CLOTHING TYPE INSULATION (clo) Naked 0 clo Light Clothing
(summer clothes)0.5 clo Medium Clothing
(full suit)1 clo Heavy Clothing
(winter military uniform)1.5 clo Table 1:
Clothing insulation values in clo, according to INSHT-NTP74.
The metabolic rate measures the energy expenditure of a worker's muscles while performing a task. A significant portion of this energy is directly converted into heat. Approximately only 25% of the energy is used for the work itself, while the rest turns into heat.
Calculating the metabolic rate is crucial not only as a variable for estimating thermal comfort using the Predicted Mean Vote but also for evaluating the physical workload associated with the task, as there is a direct relationship between the activity's intensity and the metabolic rate value.
For example, according to NTP177, light work implies a metabolic rate lower than 1600 Kcal in an 8-hour workday, between 1600 and 2000 for medium activity levels, and higher than 2000 for intense work.
Ergoniza's Fanger method software can calculate the metabolic rate using various procedures. You can also use Ergoniza's MET tool. In any case, there are five standardized procedures with varying accuracy for calculating the metabolic rate:
| Based on the profession (according to ISO 8996) |
| By activity categories (according to ISO 8996) |
| Based on the type of activity (according to INSHT - NTP 323) |
| Based on the type of activity (according to ISO 7730) |
| Based on the components of the task (according to INSHT - NTP 323) |
If the metabolic rate changes over time, calculate its weighted average value over an hour. Table 2 displays the metabolic rate values based on the activity performed, which can serve as an initial approximation for the evaluator. For calculating the Predicted Mean Vote, the Metabolic Rate variable must be measured in W/m². If the measurement is in met units, use the following conversion: (1 met = 58.15 W/m²).
CLASS RATE (W/m²) EXAMPLES OF ACTIVITIES Resting 65 Resting, sitting comfortably. Low metabolic rate 100 Writing, typing, drawing, sewing, bookkeeping, handling small tools, walking at a leisurely pace (speed up to 2.5 km/h) Moderate metabolic rate 165 Hammering nails, filing, driving trucks, tractors or construction machines, walking at a speed between 2.5 km/h and 5.5 km/h. High metabolic rate 230 Intense work with arms and torso, carrying heavy materials, cycling, using a saw, walking at a speed between 5.5 km/h and 7 km/h. Very high metabolic rate 260 Very intense activity, working with an axe, intense digging or shoveling, climbing stairs, walking at a speed above 7 km/h. Table 2:
Average metabolic rates according to the activity performed (ISO 8996).
The thermal characteristics of the environment required for applying the method are:
Air temperature measured in degrees Celsius.
If the measurement is available in Kelvin, the following conversion should be applied: T(°C)
= (T(K) - 273)
Mean radiant temperature measured in degrees Celsius.
It represents the heat exchange through radiation between the body and the surrounding surfaces. It should be indicated in degrees Celsius. The mean radiant temperature can be calculated from the measured values of dry temperature, globe temperature, and relative air velocity obtained using a psychrometer, through the following equation:
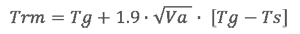
Where:
Trm is the mean radiant temperature measured in degrees Celsius (°C)
Tg is the globe temperature measured in degrees Celsius (°C)
Va is the air velocity measured in meters per second (m/s)
Ts is the dry thermometer temperature measured in degrees Celsius (°C)
Relative humidity measured in percentage.
The method also allows using the partial pressure of water
vapor measured in Pa.
Relative air velocity.
Measured in meters per second (m/s).
After completing the information gathering phase, calculate the Predicted Mean Vote (PMV). The PMV is an index that reflects the average vote of a large group of people on a 7-level thermal sensation scale (very cold, cool, slightly cool, neutral, slightly warm, warm, very warm), based on the human body's thermal balance.
Use Fanger's comfort equation to perform the calculation. This parametric equation requires iterative calculations, so it is recommended to use software support for determining the PMV value. Alternatively, you can use standardized tables from ISO 7730, but in this case, you need to obtain the operative temperature during the initial data collection.

Fanger's comfort equation
Where:

After obtaining the PMV using the comfort equation, compare its value on the thermal sensation scale in Table 3 to determine the majority of workers' overall thermal sensation under the evaluated conditions.
In the comfort equation...
The variables correspond to:
• M is the metabolic rate in W/m²
• V is the effective mechanical power in W/m² (can be estimated as 0)
• Icl is the clothing insulation in m²K/W
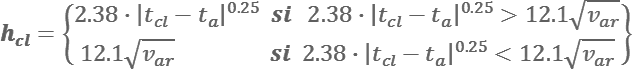
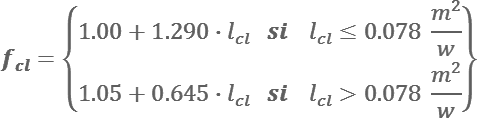
• fcl is the clothing surface factor
• ta is the air temperature in °C
• tr is the mean radiant temperature in °C
• var is the relative air velocity in m/s
• pa is the partial pressure of water vapor in pascals
pa = RH/100*exp(16.6536-4030.183/ (ta + 235))
Where: RH is the relative humidity of the air measured in percentage
• hc is the convection heat transfer coefficient in W/(m²K)
• tcl is the clothing surface temperature in °C
PMV THERMAL SENSATION +3 Very warm +2 Warm +1 Slightly warm 0 Neutral -1 Slightly cool -2 Cool -3 Very Cold Table 3:
Thermal sensation based on the estimated mean vote value.
After determining the PMV, calculate the Predicted Percentage of Dissatisfied (PPD) for the evaluated thermal environment. This index estimates the dispersion of votes around the obtained PMV and represents the percentage of people who find the thermal sensation unpleasant, too cold, or too hot.
Use the following equation to perform the calculation:

Calculation of the Predicted Percentage of Dissatisfied (PPD)
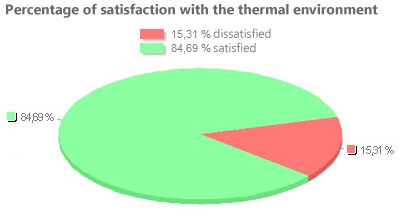
Figure 1:
Predicted Percentage of Dissatisfied PPD = 15.31%, corresponding to a PMV value of -0.7
If the Predicted Mean Vote (PMV) value falls within the range of -0.5 to 0.5, the thermal situation is satisfactory and comfortable for the majority of people. However, if it falls outside this range, the situation is considered inadequate, and corrective measures should be implemented to improve thermal sensation.
Predicted Percentage of Dissatisfied (PPD) values up to 10% reflect a satisfactory situation for most people (90% satisfied), while higher values indicate thermal discomfort. This 10% PPD value corresponds to the -0.5 and 0.5 limits specified for PMV.
The lowest achievable PPD percentage is 5%, corresponding to a situation of thermal neutrality or, in other words, a zero PMV value. The equation does not account for the ideal situation where no worker is dissatisfied with thermal conditions, estimating that at least 5% may not be satisfied under the best thermal comfort conditions.
Analyzing the values obtained from Fanger's comfort equation's various terms, which identify different heat loss mechanisms, can guide the evaluator in determining the most unfavorable thermal aspects and those requiring urgent intervention. For instance, Figure 2 shows a graphical representation of each term of the thermal balance equation for a situation with a PMV value of -0.7. The balance displays an overall heat loss (6.54 W/m2) and the amount transferred to the environment by each physiological mechanism.
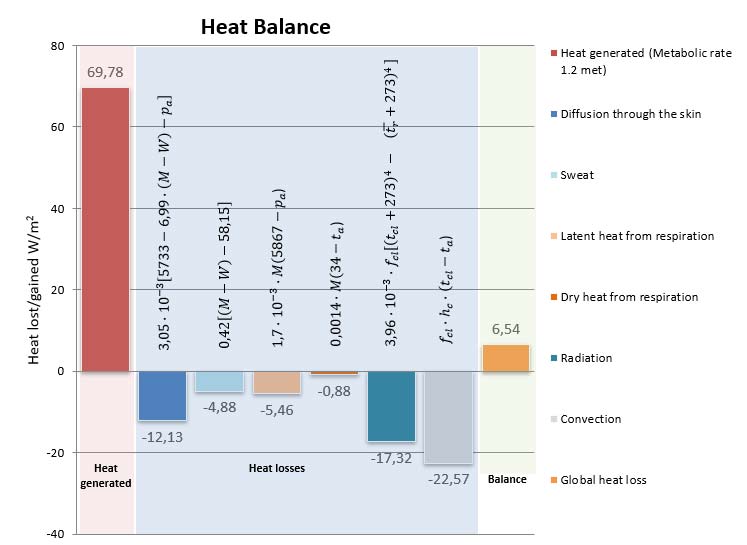
Figure 2:
Fanger - Thermal Balance.
The calculation of PMV and PPD helps identify thermal discomfort situations perceived by the body as a whole. However, factors like air currents, vertical temperature differences, and the presence of cold or hot ceilings, walls, or floors (radiant temperature asymmetry) can cause discomfort for workers even when the overall situation is deemed satisfactory by the Fanger method. In such cases, the evaluation should be supplemented with the study of local thermal discomfort.
Thermal Environment Ergonomics, Une-en Iso 7730:2006
Thermal Environment Ergonomics, Une-en Iso 8996:2004
Fanger, P.O., 1972. Thermal Confort. Mc Graw Hill, New York.
INSHT- NTP 323, Determination of energy metabolism.
INSHT- NTP 74, Thermal comfort - Fanger's method for its evaluation.
INSHT- NTP 177, Physical workload: definition and evaluation.
INSHT- NTP 501, Thermal environment: local thermal discomfort.
INSHT- NTP 322, Heat stress risk assessment: WBGT index.
Diego-Mas, Jose Antonio. Evaluation of thermal comfort with the Fanger method. Ergonautas, Universidad Politécnica de Valencia, 2023. Disponible online: https://www.ergonautas.upv.es/ergoniza/app_en/land/index.html?method=fanger
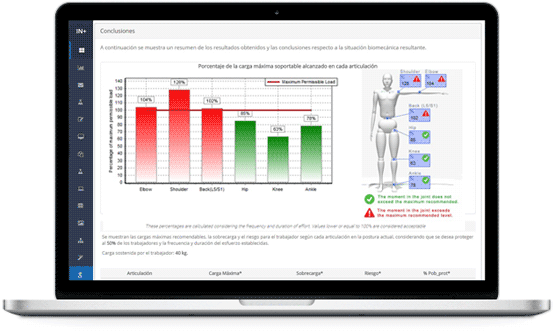
A cloud based software that integrates more than 20 tools for managing the ergonomics of the workstations in your company.
Evaluate all ergonomic risk factors of the workstations in your company: inadequate postures, repetitive movements, load handling, thermal environment...
Generate fully customizable reports in Microsoft Word or Adobe Pdf format.

Use Artificial Intelligence for automated posture detection from photographs or videos, or to automatically interpret your assessment results and obtain recommendations.
In a multiuser environment so that your company can have access to your data everywhere.
You only need a free account on Ergoniza
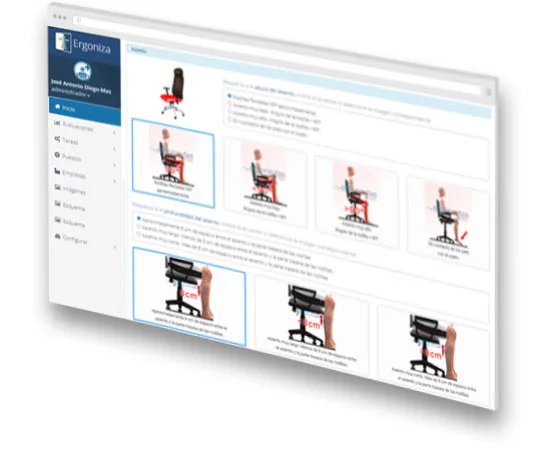
ERGONIZA allows you to use Artificial Intelligence for postural load assessment. Automatically capture workers’ postures from a photograph or a video and obtain an automated evaluation of the risk associated with inadequate or forced postures.
The Artificial Intelligence of ERGONIZA interprets the results of your assessments and automatically generates conclusions and recommendations.
AI in actionERGONIZA helps you manage the ergonomics of the workstations of your companies. Evaluate all the risk factors present in the workstations, manage the evaluations, and obtain editable and customizable reports.
You only need to register as a user of ERGONIZA to start testing.
Sign UpUnlock the full potential of Ergoniza. By becoming a Pro User you'll have access to all of Ergoniza and be able to use all of the online software without restrictions or time limits. You'll be able to use the results of evaluation methods and tools in your professional activity. You'll be able to print the results reports in pdf or Word and save your studies in files to open them later.
To register as a Pro user, you must first login to Ergoniza.
(*) In European Union countries, the price will be increased with the corresponding VAT.
(**) The price in american dollars has been calculated at the current exchange rate and may vary.
is a web by . Ergonautas is the specialized website in occupational ergonomics and ergonomic assessment of workstations at the . Ergonautas aims to be a useful support tool for the Occupational Risk Prevention and Ergonomics professional and people in training, providing rigorous technical information on occupational ergonomics, online tools for its application, research, training, and participation forums.
Ergonautas is formed by a large human team. In addition to technicians and programmers, the Ergonautas team is made up of researchers and professors from the Polytechnic University of Valencia. The team, led by José Antonio Diego Más, is at the forefront of research and teaching in ergonomics, teaching in official degrees and master's degrees, and developing research projects in the field of ergonomics and new technologies oriented towards humans.
If you need to know more, get in touch with Ergonautas
Or follow us on Linkedin
- - -
© 2006 - Universidad Politécnica de Valencia